CCT - Crypto Currency Tracker logo CCT - Crypto Currency Tracker logo
Crypto Potato 2024-12-25 07:08:46

Ethereum Price Analysis: Is ETH Doomed to Slump to $3K After Getting Rejected at $4K?

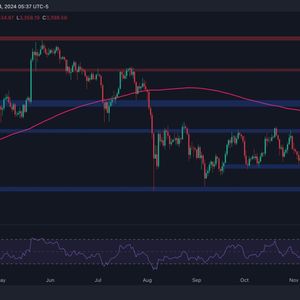
Ethereum’s price has failed to make its way toward a new record high and is currently experiencing bearish price action, leaving market participants worried that the bull run might be over. The asset now remains below $3,500, which has turned into a key resistance line. Technical Analysis By Edris Derakhshi (TradingRage) The Daily Chart On the daily chart, the price has entered a bullish phase since the beginning of November after rebounding from the $2,300 support level. However, the $4,000 resistance zone has rejected the market to the downside, with the $3,500 level also being lost. Currently, it is likely for the market to drop toward the $3,000 support zone and the 200-day moving average, located around the same price mark. As long as ETH trades above the 200-day moving average, the overall market trend can be considered bullish. Otherwise, a deeper drop toward the $2,000 area could be expected. The 4-Hour Chart Looking at the 4-hour timeframe, it is evident that the market has failed to break above the $4,000 resistance level twice, forming a clear double-top pattern. With the neckline of the pattern, which is the $3,500 level, broken to the downside and the RSI showing bearish momentum, the market could correct more or even consolidate in the coming weeks before it is able to continue its upward trajectory. Sentiment Analysis By Edris Derakhshi (TradingRage) Ethereum Taker Buy Sell Ratio While Ethereum’s price has been struggling to continue its rally and create a new all-time high, analyzing the futures market sentiment could yield helpful insights about the potential reasons behind this correction and whether it will be over soon or not. This chart presents the Taker Buy Sell Ratio metric, which measures whether the buyers or the sellers are executing their positions more aggressively on aggregate, using market orders. As the chart suggests, the 100-day moving average of the Taker Buy Sell Ratio has been showing values below one for over a year now, with the metric currently experiencing a massive drop. This indicates that the recent correction might be due to the selling pressure coming from the futures market rather than the spot market, and as long as the metric is trending down, it will be difficult for the market to recover. The post Ethereum Price Analysis: Is ETH Doomed to Slump to $3K After Getting Rejected at $4K? appeared first on CryptoPotato .

Leggi la dichiarazione di non responsabilità : Tutti i contenuti forniti nel nostro sito Web, i siti con collegamento ipertestuale, le applicazioni associate, i forum, i blog, gli account dei social media e altre piattaforme ("Sito") sono solo per le vostre informazioni generali, procurati da fonti di terze parti. Non rilasciamo alcuna garanzia di alcun tipo in relazione al nostro contenuto, incluso ma non limitato a accuratezza e aggiornamento. Nessuna parte del contenuto che forniamo costituisce consulenza finanziaria, consulenza legale o qualsiasi altra forma di consulenza intesa per la vostra specifica dipendenza per qualsiasi scopo. Qualsiasi uso o affidamento sui nostri contenuti è esclusivamente a proprio rischio e discrezione. Devi condurre la tua ricerca, rivedere, analizzare e verificare i nostri contenuti prima di fare affidamento su di essi. Il trading è un'attività altamente rischiosa che può portare a perdite importanti, pertanto si prega di consultare il proprio consulente finanziario prima di prendere qualsiasi decisione. Nessun contenuto sul nostro sito è pensato per essere una sollecitazione o un'offerta