CCT - Crypto Currency Tracker logo CCT - Crypto Currency Tracker logo
cryptonews 2024-12-11 15:19:43

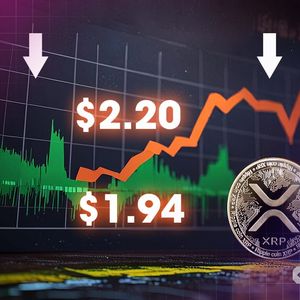
XRP Price Drops Below $2.20 – Was $1.94 the Key to Its Next Bullish Surge?

XRP has been on a rollercoaster ride in the past 24 hours, crashing below $2 and now trading at $2.40 after a 28% surge from the local bottom. Interestingly, the XRP price appears to have beaten other leading altcoins to the punch with its 5.12% uptick since 00:00 UTC, affirming bullish end-of-year projections for the altcoin . While XRP did not escape the liquidation event unscathed, suffering a 12.34% drawdown, it has been the quickest to recover. Coupled with a 12% jump in trading volume to $24 billion, it seems that the reversal is backed by significant momentum. Is XRP Clear of the Crash? The uptick today represents a play-out of bullish predictions by expert analyst Casi Trades on X . In her recent analysis, she noted two scenarios that could lead to a reversal and set the XRP price well on the path to a new all-time high. Though the first scenario did not come to fruition, the second one has, with the 0.382 Fibonacci retracement level ($1.94–$2.04) proving a “pivot point” in the recent downtrend, following an ABC pattern. Here’s some positive perspective on this correction: A .382 retrace still aligns our extension targets perfectly with #XRP 's previous ATH—markets love this kind of symmetry! Unless $1.94 is broken, this target holds! https://t.co/VxDAq7Pyy5 — CasiTrades (@CasiTrades) December 10, 2024 The successful bounce from this support has re-ignited bullish momentum, seen in today’s surge, and reaffirmed a potential path to XRP’s past all-time high at $3.50. Particularly as the bearish symmetrical triangle pattern breakout neared its target, $1.94 does seem a credible bottom to the correction. XRP Price Analysis: Is a New All-Time High Next? Going forward, XRP’s path to a new all-time high seems credible with the formation of an ascending broadening wedge since early November. XRP / USDT 4H Chart, ascending broadening wedge pattern. Source: Binance. The lower support trendline of the pattern affirms a local bottom for a correction, aligning with Casi’s support zone at $1.94. While a retest of the 50 SMA may temporarily stall today’s growth, the MACD line indicates bullish sentiment with a crossover above the signal line. This move, in recent history, has consistently led to significant upticks in the XRP price. Therefore, a push to $3.50, representing a 50% advance on current prices, seems plausible. However, the analyst notes the range between $3.50 and $3.74 remains a critical pivot zone where the market will define future trends. The post XRP Price Drops Below $2.20 – Was $1.94 the Key to Its Next Bullish Surge? appeared first on Cryptonews .

Leggi la dichiarazione di non responsabilità : Tutti i contenuti forniti nel nostro sito Web, i siti con collegamento ipertestuale, le applicazioni associate, i forum, i blog, gli account dei social media e altre piattaforme ("Sito") sono solo per le vostre informazioni generali, procurati da fonti di terze parti. Non rilasciamo alcuna garanzia di alcun tipo in relazione al nostro contenuto, incluso ma non limitato a accuratezza e aggiornamento. Nessuna parte del contenuto che forniamo costituisce consulenza finanziaria, consulenza legale o qualsiasi altra forma di consulenza intesa per la vostra specifica dipendenza per qualsiasi scopo. Qualsiasi uso o affidamento sui nostri contenuti è esclusivamente a proprio rischio e discrezione. Devi condurre la tua ricerca, rivedere, analizzare e verificare i nostri contenuti prima di fare affidamento su di essi. Il trading è un'attività altamente rischiosa che può portare a perdite importanti, pertanto si prega di consultare il proprio consulente finanziario prima di prendere qualsiasi decisione. Nessun contenuto sul nostro sito è pensato per essere una sollecitazione o un'offerta